Terms of Service
WE OPERATE UNDER MARITIME LAW
Introduction and Acceptance
Please read these terms of use carefully before using Panama Posse (hereinafter, “us”, “we”, or “PanamaPosse .com”). By accessing and/or using Panama Posse (other than to read these terms of use for the first time) you are agreeing to comply with these terms of use, which may change from time to time as set forth in section 16 below. if you do not agree to be bound by these terms of use, do not access or use PanamaPosse .com.
You agree that these Terms of Use are supported by good and valuable consideration the receipt and sufficiency of which you hereby acknowledge. Such consideration includes, without limitation, your use of Panama Posse and the materials and information available on the same.
In addition to these Terms of Use, Panama Posse has established a Privacy Policy to explain how user information is collected and used by PanamaPosse .com. A copy of this Privacy Policy can be found here: /privacy-policy/ and is incorporated by reference into these Terms of Use. By accessing or using any of our Websites, you are signifying your acknowledgement and agreement to PanamaPosse .com’s Privacy Policy.
Intellectual Property
Panama Posse and included content (and any derivative works or enhancements of the same) including, but not limited to, all text, illustrations, files, images, software, scripts, graphics, photos, sounds, music, videos, information, content, materials, products, services, URLs, technology, documentation, and interactive features (collectively, the “Website Content”) and all intellectual property rights to the same are owned by us, our licensors, or both. Additionally, all trademarks, service marks, trade names and trade dress that may appear on our Websites are owned by us, our licensors, or both. You shall not acquire any right, title or interest in our Websites or any Website Content. Any rights not expressly granted in these Terms of Use are expressly reserved.
Panama Posse Access and Use
When accessing our Websites, including without limitation to the Website Content, you agree to comply with all applicable federal, state, and local laws including, without limitation copyright law. Except as expressly permitted in these Terms of Use, you may not use, reproduce, distribute, create derivative works based upon, publicly display, publicly perform, publish, transmit, or otherwise exploit Website Content for any purpose whatsoever without obtaining prior written consent from us or, in the case of third-party content, its respective owner. You acknowledge that you do not acquire any ownership rights by downloading or printing Website Content.
Furthermore, except as expressly permitted in these Terms of Use, you may not:
remove, alter, cover, or distort any copyright, trademark, or other proprietary rights notice on Panama Posse or Website Content;
circumvent, disable or otherwise interfere with security-related features of our Websites including, without limitation, any features that prevent or restrict use or copying of any content or enforce limitations on the use of our Websites or Website Content;
use an automatic device (such as a robot or spider) or manual process to copy or “scrape” our Websites or Website Content for any purpose without the express written permission of PanamaPosse .com. Notwithstanding the foregoing, Panama Posse grants public search engine operators permission to use automatic devices (such as robots or spiders) to copy Website Content from our Websites for the sole purpose of creating (and only to the extent necessary to create) a searchable index of Website Content that is available to the public. Panama Posse reserves the right to revoke this permission (generally or specifically) at any time;
collect or harvest any personally identifiable information from our Websites including, without limitation, user names, passwords, email addresses;
solicit other users to join or become members of any commercial online service or other organization without our prior written approval;
attempt to or interfere with the proper working of our Websites or impair, overburden, or disable the same;
decompile, reverse engineer, or disassemble any portion of any our Websites;
use network-monitoring software to determine architecture of or extract usage data from any of our Websites;
encourage conduct that violates any local, state or federal law, either civil or criminal, or impersonate another user, person, or entity (e.g., using another person’s Membership (as defined in Section B) without permission, etc.);
export laws, including, without limitation, violations of the Export Administration Act and the Export Administration Regulations administered by the Department of Commerce; or
engage in any conduct that restricts or inhibits any other user from using or enjoying our Websites.
You agree to cooperate fully with Panama Posse to investigate any suspected or actual activity that is in breach of these Terms of Use.
User Registration
In order to access or use some features of PanamaPosse .com, you will have to become a registered user. If you are under the age of eighteen, then you are not permitted to register as a user or otherwise submit personal information to PanamaPosse .com.
If you become a registered user, you will provide true, accurate and complete registration information and, if such information changes, you will promptly update the relevant registration information. During registration, you will create a user name and password (a “Membership”), which may permit you access to certain areas of our Websites not available to non-registered users. You are responsible for safeguarding and maintaining the confidentiality of your Membership. You are solely responsible for the activity that occurs under your Membership, whether or not you have authorized the activity. You agree to notify us immediately at https://www.PanamaPosse .com/ of any breach of security or unauthorized use of your Membership.
User Content
We may now or in the future permit users to post, upload, transmit through, or otherwise make available on our Websites (collectively, “submit”) messages, templates, text, illustrations, files, images, graphics, photos, comments, sounds, music, videos, information, content, and/or other materials (“User Content”). Subject to the rights and license you grant herein, you retain all right, title and interest in your User Content. We do not guarantee any confidentiality with respect to User Content even if it is not published on our Websites. It is solely your responsibility to monitor and protect any intellectual property rights that you may have in your User Content, and we do not accept any responsibility for the same.
You shall not submit any User Content protected by copyright, trademark, patent, trade secret, moral right, or other intellectual property or proprietary right without the express permission of the owner of the respective right. You are solely liable for any damage resulting from your failure to obtain such permission or from any other harm resulting from User Content that you submit.
You represent, warrant, and covenant that you will not submit any User Content that:
violates or infringes in any way upon the rights of others, including, but not limited to, any copyright, trademark, patent, trade secret, moral right, or other intellectual property or proprietary right of any person or entity;
impersonates another or is unlawful, threatening, abusive, libelous, defamatory, invasive of privacy or publicity rights, vulgar, obscene, profane, pornographic, or otherwise objectionable;
encourages conduct that would constitute a criminal offense, give rise to civil liability or otherwise violate any law;
is an advertisement for goods or services or a solicitation of funds;
includes personal information such as messages which identify phone numbers, social security numbers, account numbers, addresses, or employer references;
contains a formula, instruction, or advice that could cause harm or injury; or
is a chain letter of any kind.
Moreover, any conduct by a user that in our sole discretion restricts or inhibits any other user from using or enjoying our Websites will not be permitted.
By submitting User Content to us, simultaneously with such posting you automatically grant, or warrant that the owner has expressly granted, to us a worldwide, royalty-free, perpetual, irrevocable, non-exclusive, fully sublicensable, and transferable right and license to use, reproduce, distribute, create derivative works based upon (including, without limitation, translations), publicly display, publicly perform, transmit, and publish the User Content (in whole or in part) as we, in our sole discretion, deem appropriate including, without limitation, (1) in connection with our business; and (2) in connection with the businesses of our successors, parents, subsidiaries, and their related companies. We may exercise this grant in any format, media or technology now known or later developed for the full term of any copyright that may exist in such User Content. Furthermore, you also grant other users permission to access your User Content and to use, reproduce, distribute, create derivative works based upon, publicly display, publicly perform, transmit, and publish your User Content for personal, non-commercial use as permitted by the functionality of any of our Websites and these Terms of Use.
By submitting User Content, you also grant us the right, but not the obligation to use your biographical information including, without limitation, your name and geographical location in connection with broadcast, print, online, or other use or publication of your User Content. Notwithstanding the foregoing, you waive any and all claims you may now or later have in any jurisdiction to so-called “moral rights” or rights of “droit moral” with respect to the User Content.
We reserve the right to display advertisements in connection with your User Content and to use your User Content for advertising and promotional purposes. You acknowledge and agree that your User Content may be included on the websites and advertising networks of our distribution partners and third-party service providers (including their downstream users).
We have the right, but not the obligation, to monitor User Content. We have the right in our sole discretion and for any reason whatsoever to edit, refuse to post, remove, or disable access to any User Content.
Website Content & Third Party Links
We provide our Websites and Website Content, for the commercial, entertainment and promotional purposes of providing web-based services for the web design and web development of others. You may not rely on any information and opinions expressed on any of our Websites for any other purpose. In all instances, it is your responsibility to evaluate the accuracy, timeliness, completeness, or usefulness of Website Content. Under no circumstances will we be liable for any loss or damage caused by your reliance on any Website Content.
In many instances, Website Content will include content posted by a third-party or will represent the opinions and judgments of a third-party. We do not endorse, warrant and are not responsible for the accuracy, timeliness, completeness, or reliability of any opinion, advice, or statement made on our Websites by anyone other than authorized employees or spokespersons while acting in their official capacities.
If there is a dispute between persons accessing our Websites or between persons accessing our Websites and any third party, you understand and agree that we are under no obligation to become involved. If there is such a dispute, you hereby release Panama Posse and its officers, directors, employees, parents, partners, successors, agents, affiliates, subsidiaries, and their related companies from claims, demands, and damages of every kind or nature arising out of, relating to, or in any way connected with such dispute.
Our Websites may contain links to other websites maintained by third parties. We do not operate or control, in any respect, or necessarily endorse the content found on these third-party websites. You assume sole responsibility for your use of third-party links. We are not responsible for any content posted on third-party websites or liable to you for any loss or damage of any sort incurred as a result of your dealings with any third-party or their website.
Indemnification
You agree to indemnify and hold harmless Panama Posse and its officers, directors, employees, parents, partners, successors, agents, distribution partners, affiliates, subsidiaries, and their related companies from and against any and all claims, liabilities, losses, damages, obligations, costs and expenses (including reasonable attorneys’ fees and costs) arising out of, related to, or that may arise in connection with: (i) your access to or use of any of our Websites; (ii) User Content provided by you or through use of your Membership; (iii) any actual or alleged violation or breach by you of these Terms of Use; (iv) any actual or alleged breach of any representation, warranty, or covenant that you have made to us; or (v) your acts or omissions. You agree to cooperate fully with us in the defense of any claim that is the subject of your obligations hereunder.
Disclaimers
YOU EXPRESSLY AGREE THAT USE OF OUR WEBSITES IS AT YOUR SOLE RISK. OUR WEBSITES AND WEBSITE CONTENT ARE PROVIDED ON AN “AS IS” AND “AS AVAILABLE” BASIS WITHOUT WARRANTY OF ANY KIND, EITHER EXPRESS OR IMPLIED. WITHOUT LIMITING THE FOREGOING AND TO THE FULLEST EXTENT PERMITTED BY LAW, PANAMA POSSE AND ITS OFFICERS, DIRECTORS, EMPLOYEES, PARENTS, PARTNERS, SUCCESSORS, AGENTS, DISTRIBUTION PARTNERS, AFFILIATES, SUBSIDIARIES, AND THEIR RELATED COMPANIES DISCLAIM ANY AND ALL WARRANTIES INCLUDING ANY: (1) WARRANTIES THAT THE WEBSITES WILL MEET YOUR REQUIREMENTS; (2) WARRANTIES CONCERNING THE AVAILABILITY, ACCURACY, SECURITY, USEFULNESS, TIMELINESS, OR INFORMATIONAL CONTENT OF THE PANAMAPOSSE .COM; (3) WARRANTIES OF TITLE, NON-INFRINGEMENT, MERCHANTABILITY, OR FITNESS FOR A PARTICULAR PURPOSE; (4) WARRANTIES FOR SERVICES OR GOODS RECEIVED THROUGH OR ADVERTISED ON OUR WEBSITES OR ACCESSED THROUGH ANY OF OUR WEBSITES; (5) WARRANTIES CONCERNING THE ACCURACY OR RELIABILITY OF THE RESULTS THAT MAY BE OBTAINED FROM THE USE OF THE WEBSITES; (6) WARRANTIES THAT YOUR USE OF THE WEBSITES WILL BE SECURE OR UNINTERRUPTED; AND (7) WARRANTIES THAT ERRORS IN THE SOFTWARE WILL BE CORRECTED.
Limitation on Liability
UNDER NO CIRCUMSTANCES SHALL PANAMA POSSE OR ITS OFFICERS, DIRECTORS, EMPLOYEES, PARENTS, PARTNERS, SUCCESSORS, AGENTS, DISTRIBUTION PARTNERS, AFFILIATES, SUBSIDIARIES, OR THEIR RELATED COMPANIES BE LIABLE FOR INDIRECT, INCIDENTAL, SPECIAL, CONSEQUENTIAL OR EXEMPLARY DAMAGES (EVEN IF PANAMA POSSE HAS BEEN ADVISED OF THE POSSIBILITY OF SUCH DAMAGES), ARISING OUT OF, RELATING TO, OR IN ANY WAY CONNECTED WITH OUR WEBSITES OR THESE TERMS OF USE. YOUR SOLE REMEDY FOR DISSATISFACTION WITH OUR WEBSITES INCLUDING, WITHOUT LIMITATION, THE WEBSITE CONTENT IS TO STOP USING OUR WEBSITES. SUCH LIMITATION SHALL ALSO APPLY WITH RESPECT TO DAMAGES INCURRED BY REASON OF SERVICES OR PRODUCTS RECEIVED THROUGH OR ADVERTISED IN CONNECTION WITH ANY OF OUR WEBSITES OR ANY LINKS ON OUR WEBSITES, AS WELL AS BY REASON OF ANY INFORMATION OR ADVICE RECEIVED THROUGH OR ADVERTISED IN CONNECTION WITH ANY OF OUR WEBSITES OR ANY LINKS ON OUR WEBSITES. SUCH LIMITATION SHALL ALSO APPLY WITH RESPECT TO DAMAGES INCURRED BY REASON OF ANY CONTENT POSTED BY A THIRD-PARTY OR CONDUCT OF A THIRD-PARTY ON OUR WEBSITES.
NOTWITHSTANDING ANYTHING TO THE CONTRARY CONTAINED HEREIN, IN NO EVENT SHALL THE CUMULATIVE LIABILITY OF PANAMA POSSE AND ITS OFFICERS, DIRECTORS, EMPLOYEES, PARENTS, PARTNERS, SUCCESSORS, AGENTS, DISTRIBUTION PARTNERS, AFFILIATES, SUBSIDIARIES, AND THEIR RELATED COMPANIES EXCEED THE GREATER OF THE TOTAL PAYMENTS RECEIVED FROM YOU BY PANAMA POSSE DURING THE PRECEDING TWELVE (12) MONTH PERIOD OR $100. FURTHERMORE, YOU AGREE THAT ANY CAUSE OF ACTION ARISING OUT OF, RELATING TO, OR IN ANY WAY CONNECTED WITH ANY OF OUR WEBSITES OR THESE TERMS OF USE MUST COMMENCE WITHIN ONE (1) YEAR AFTER THE CAUSE OF ACTION ACCRUES; OTHERWISE, SUCH CAUSE OF ACTION SHALL BE PERMANENTLY BARRED.
In some jurisdictions limitations of liability are not permitted. In such jurisdictions, some of the foregoing limitations may not apply to you. These limitations shall apply to the fullest extent permitted by law.
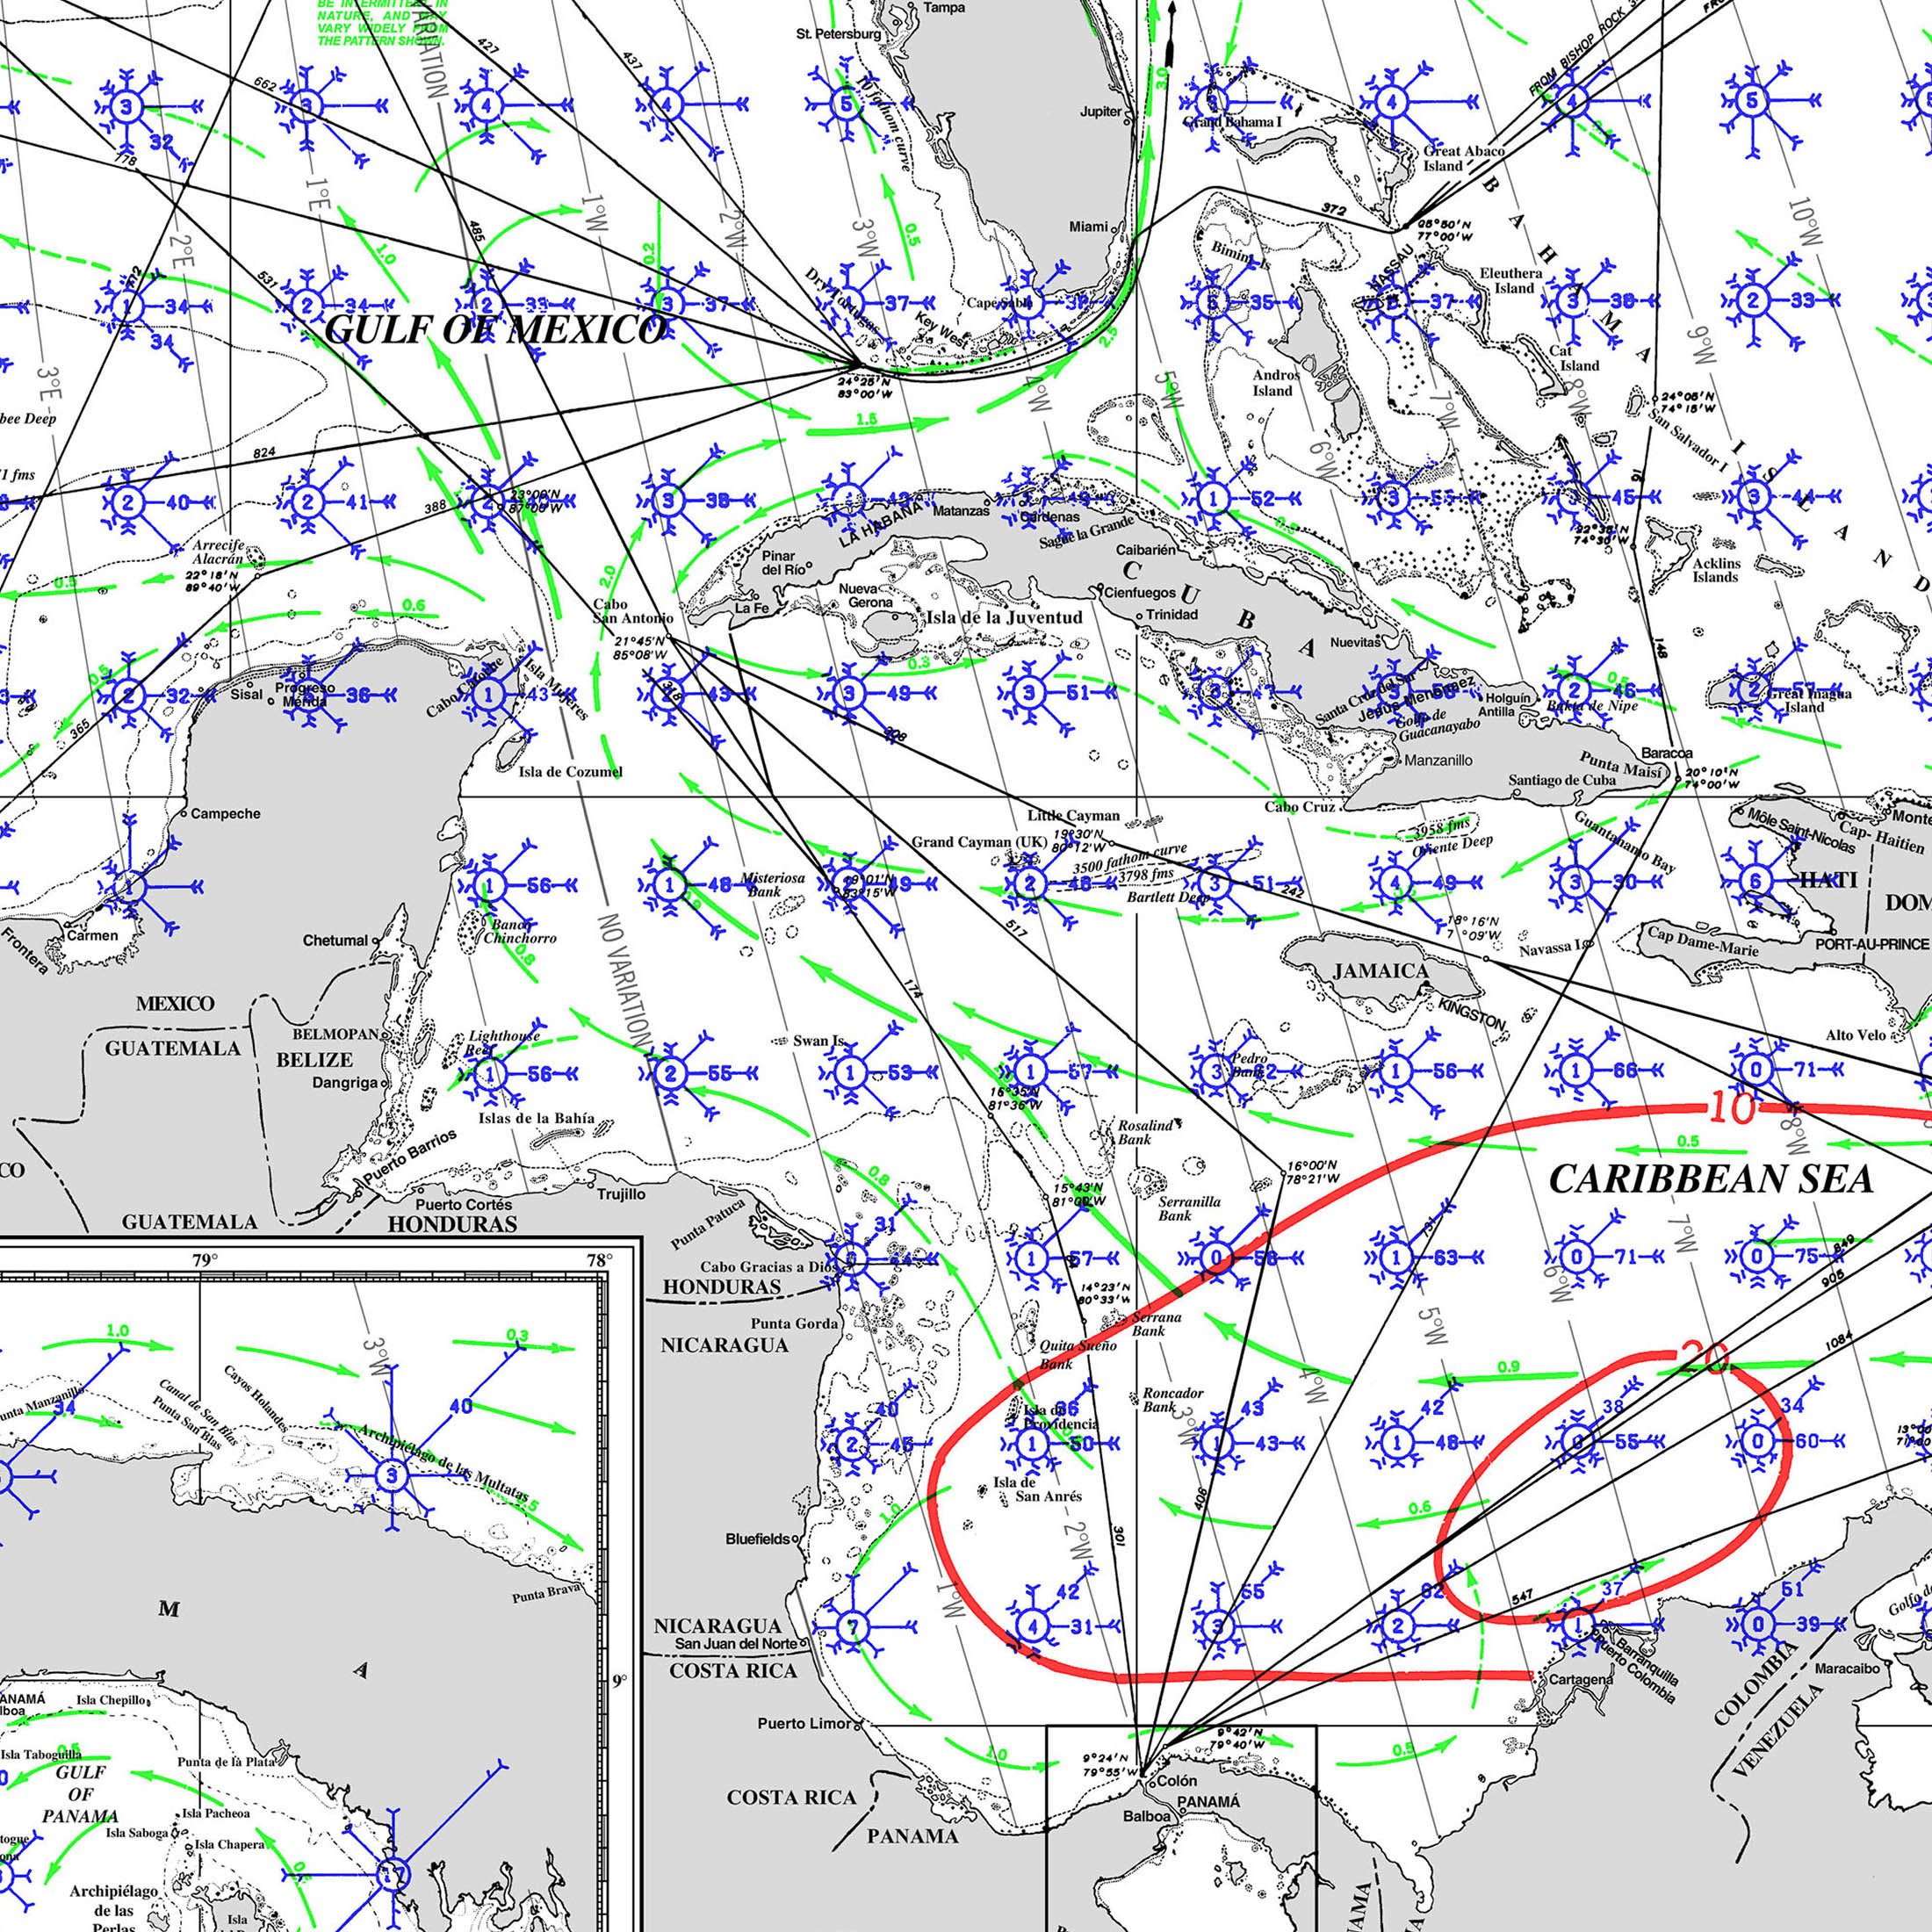
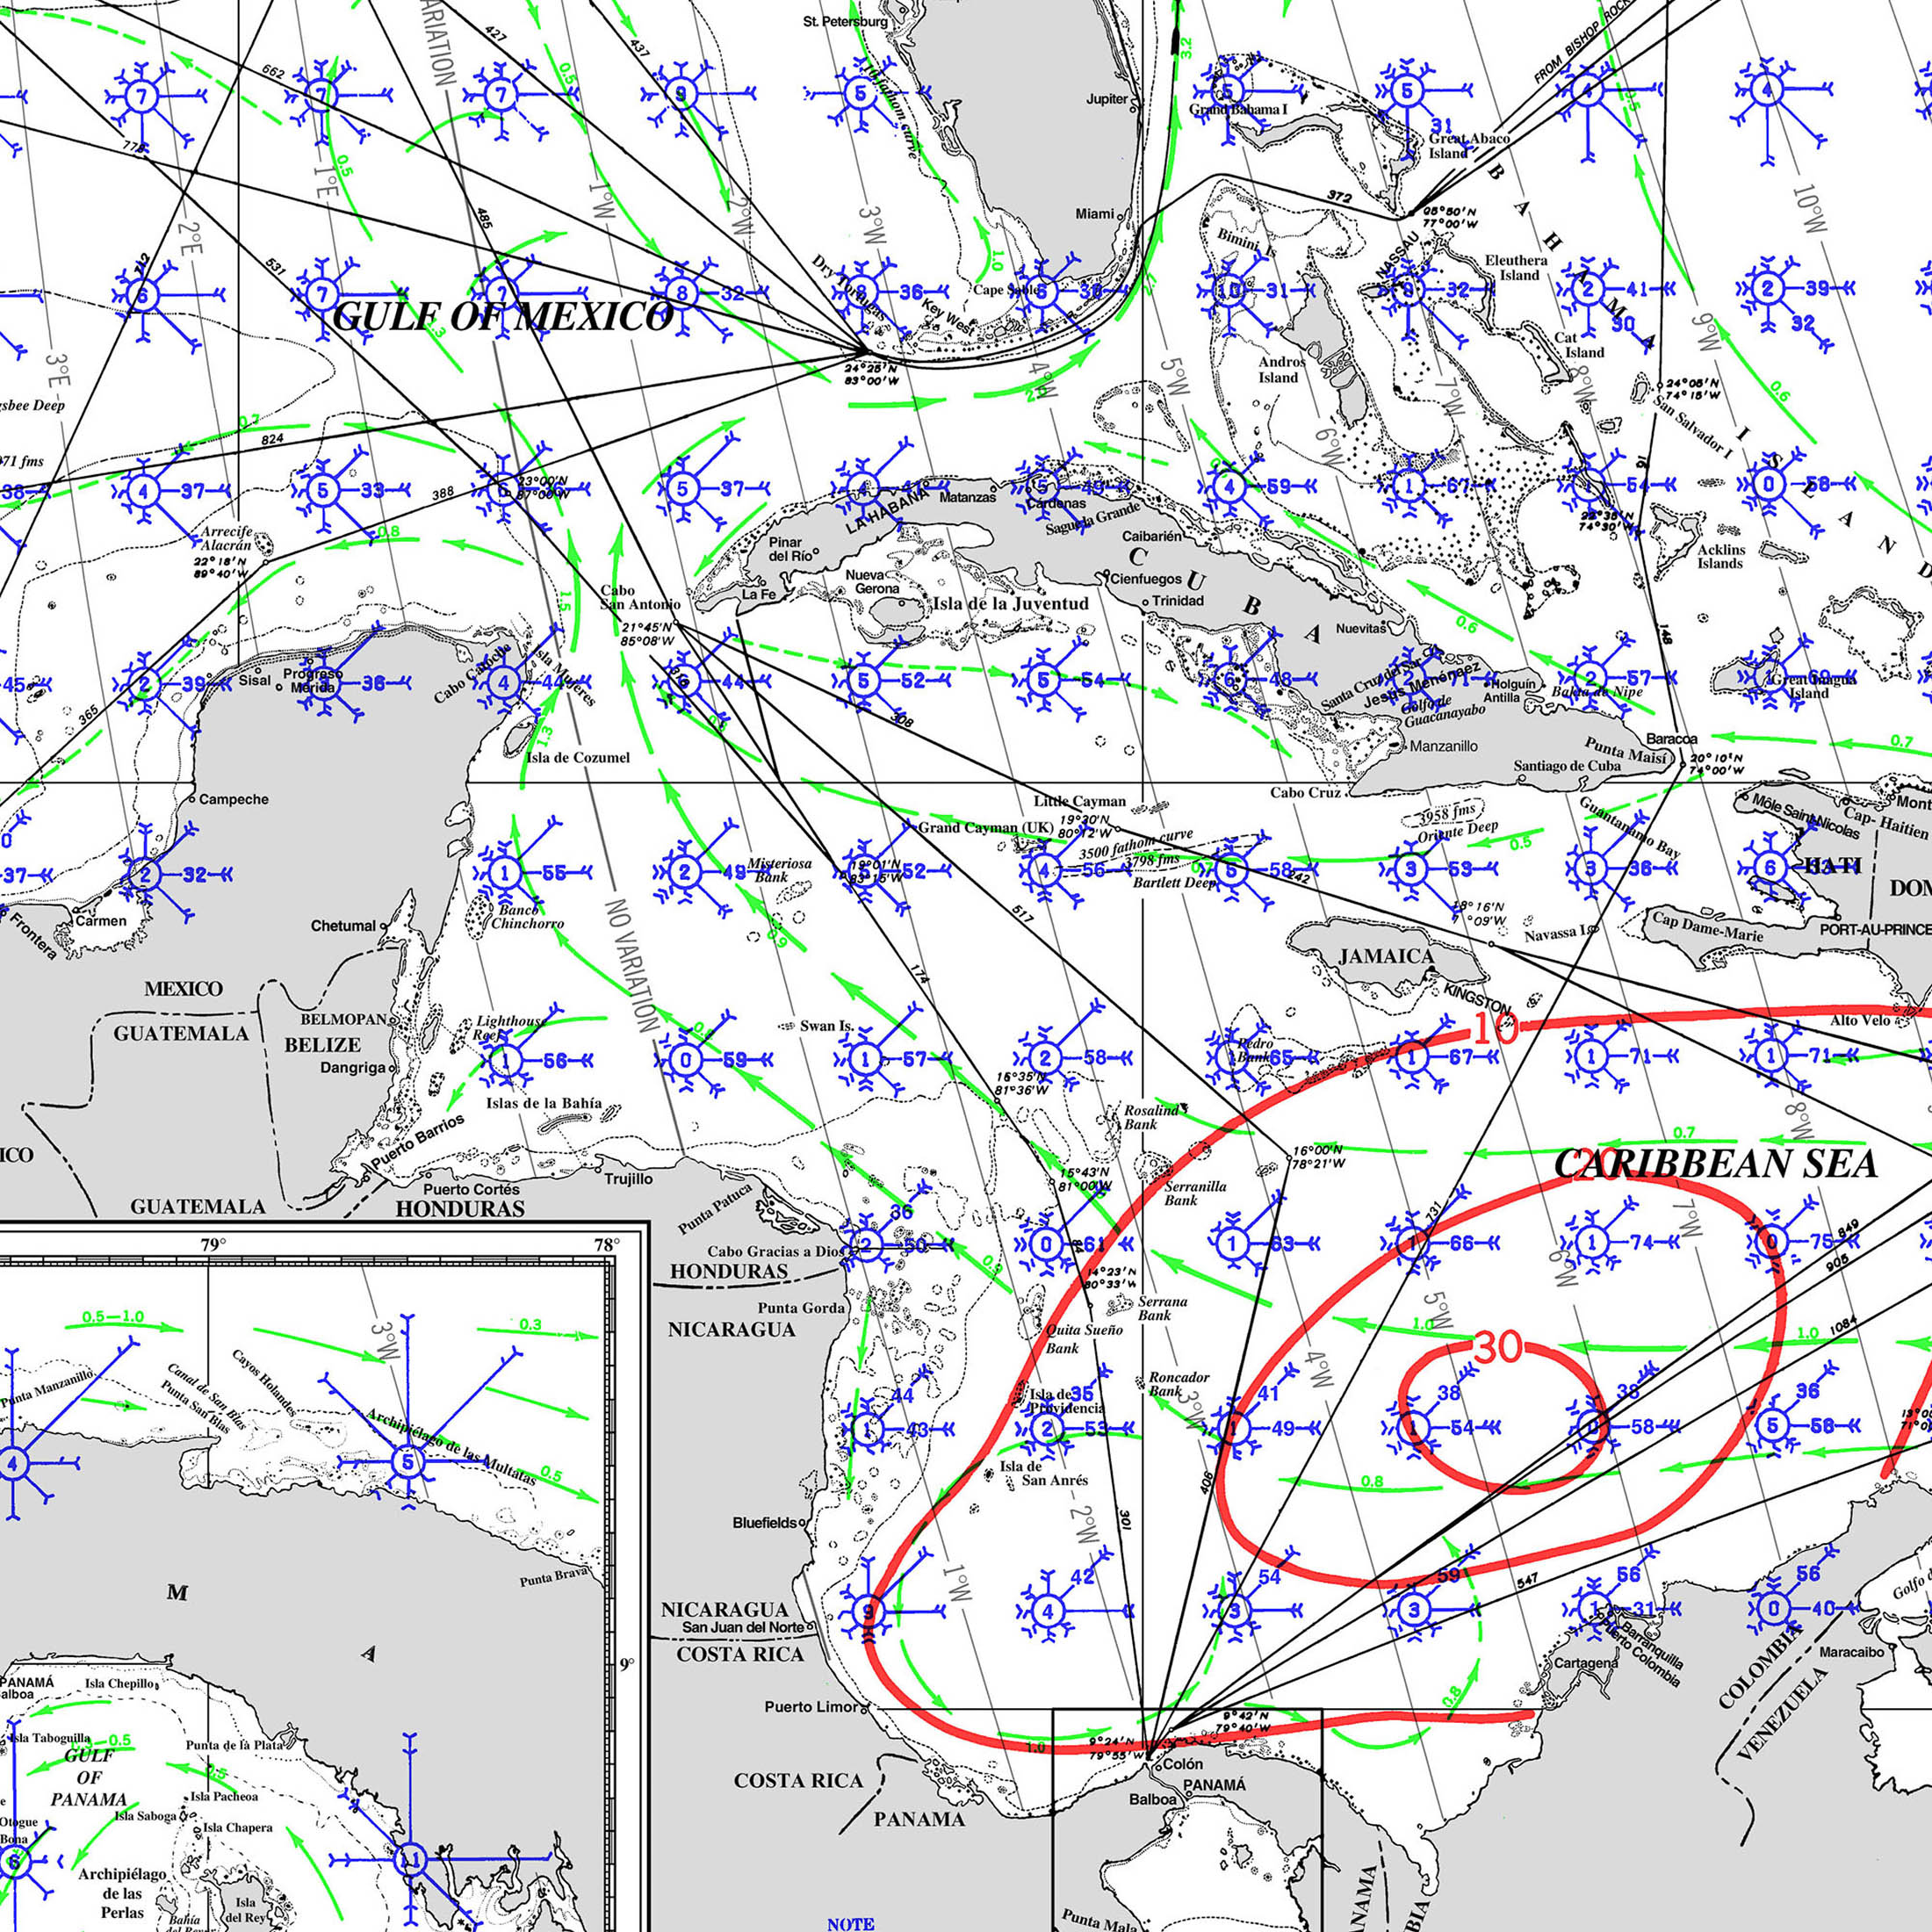
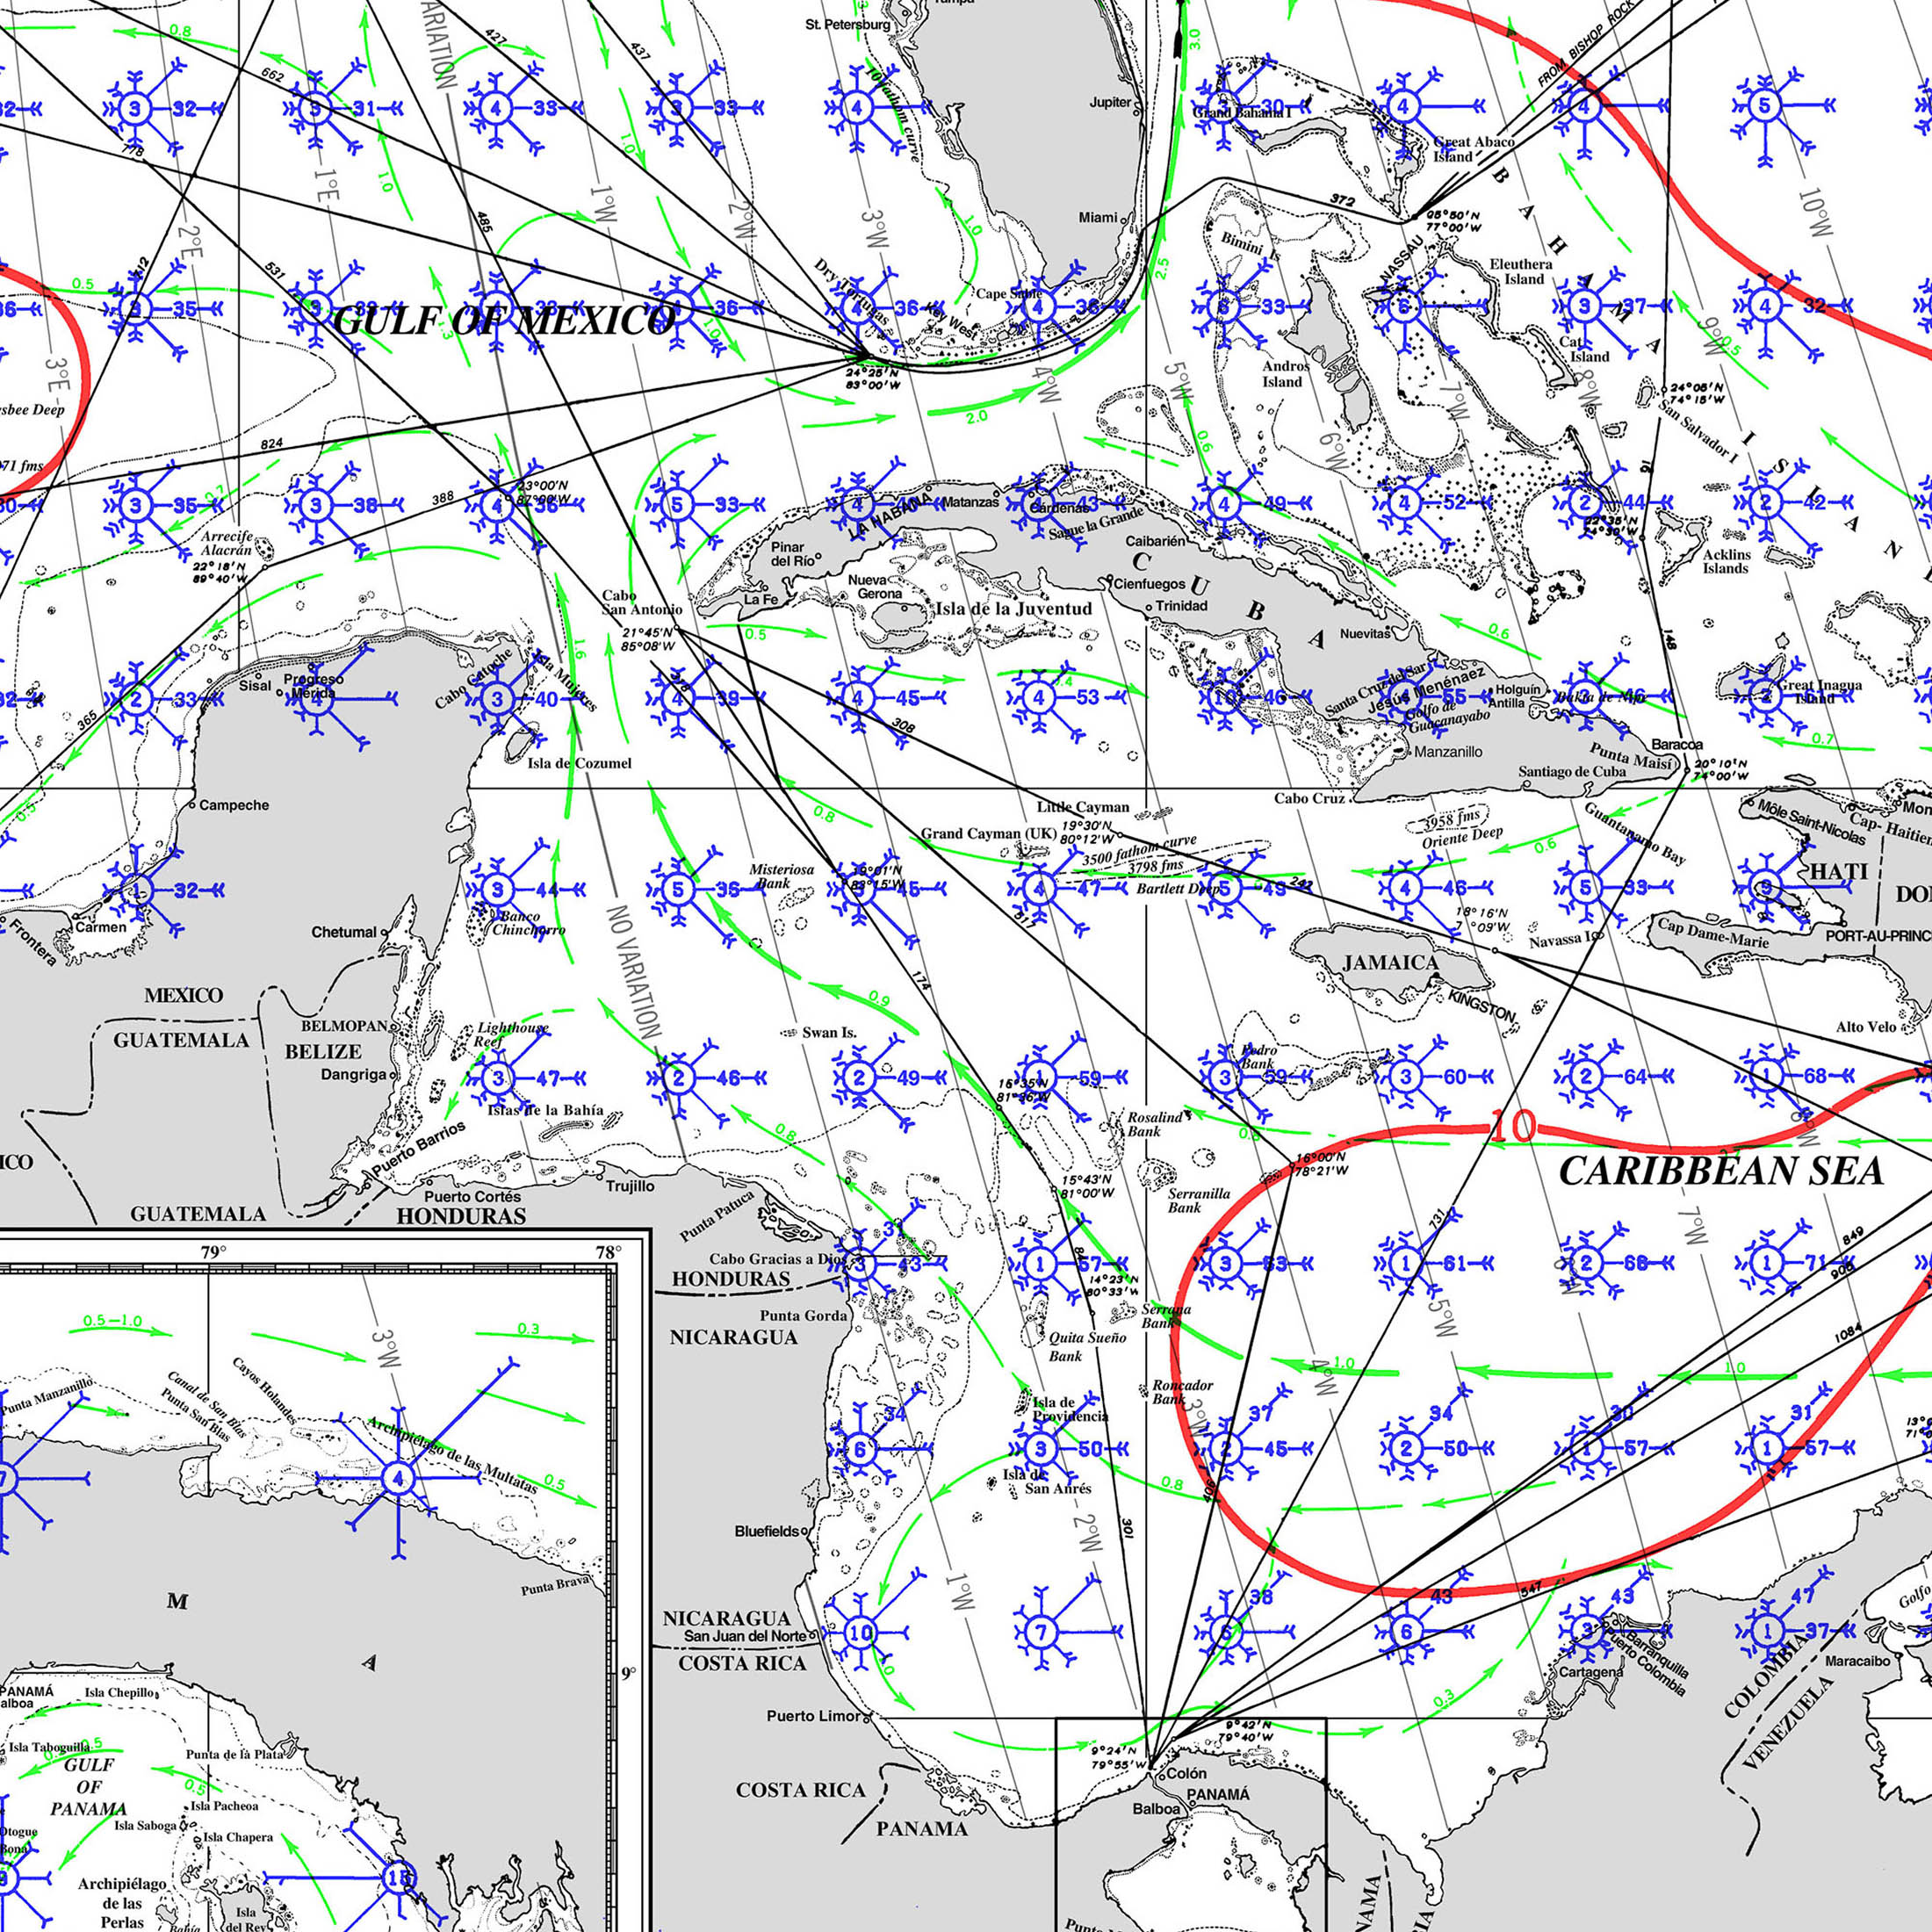
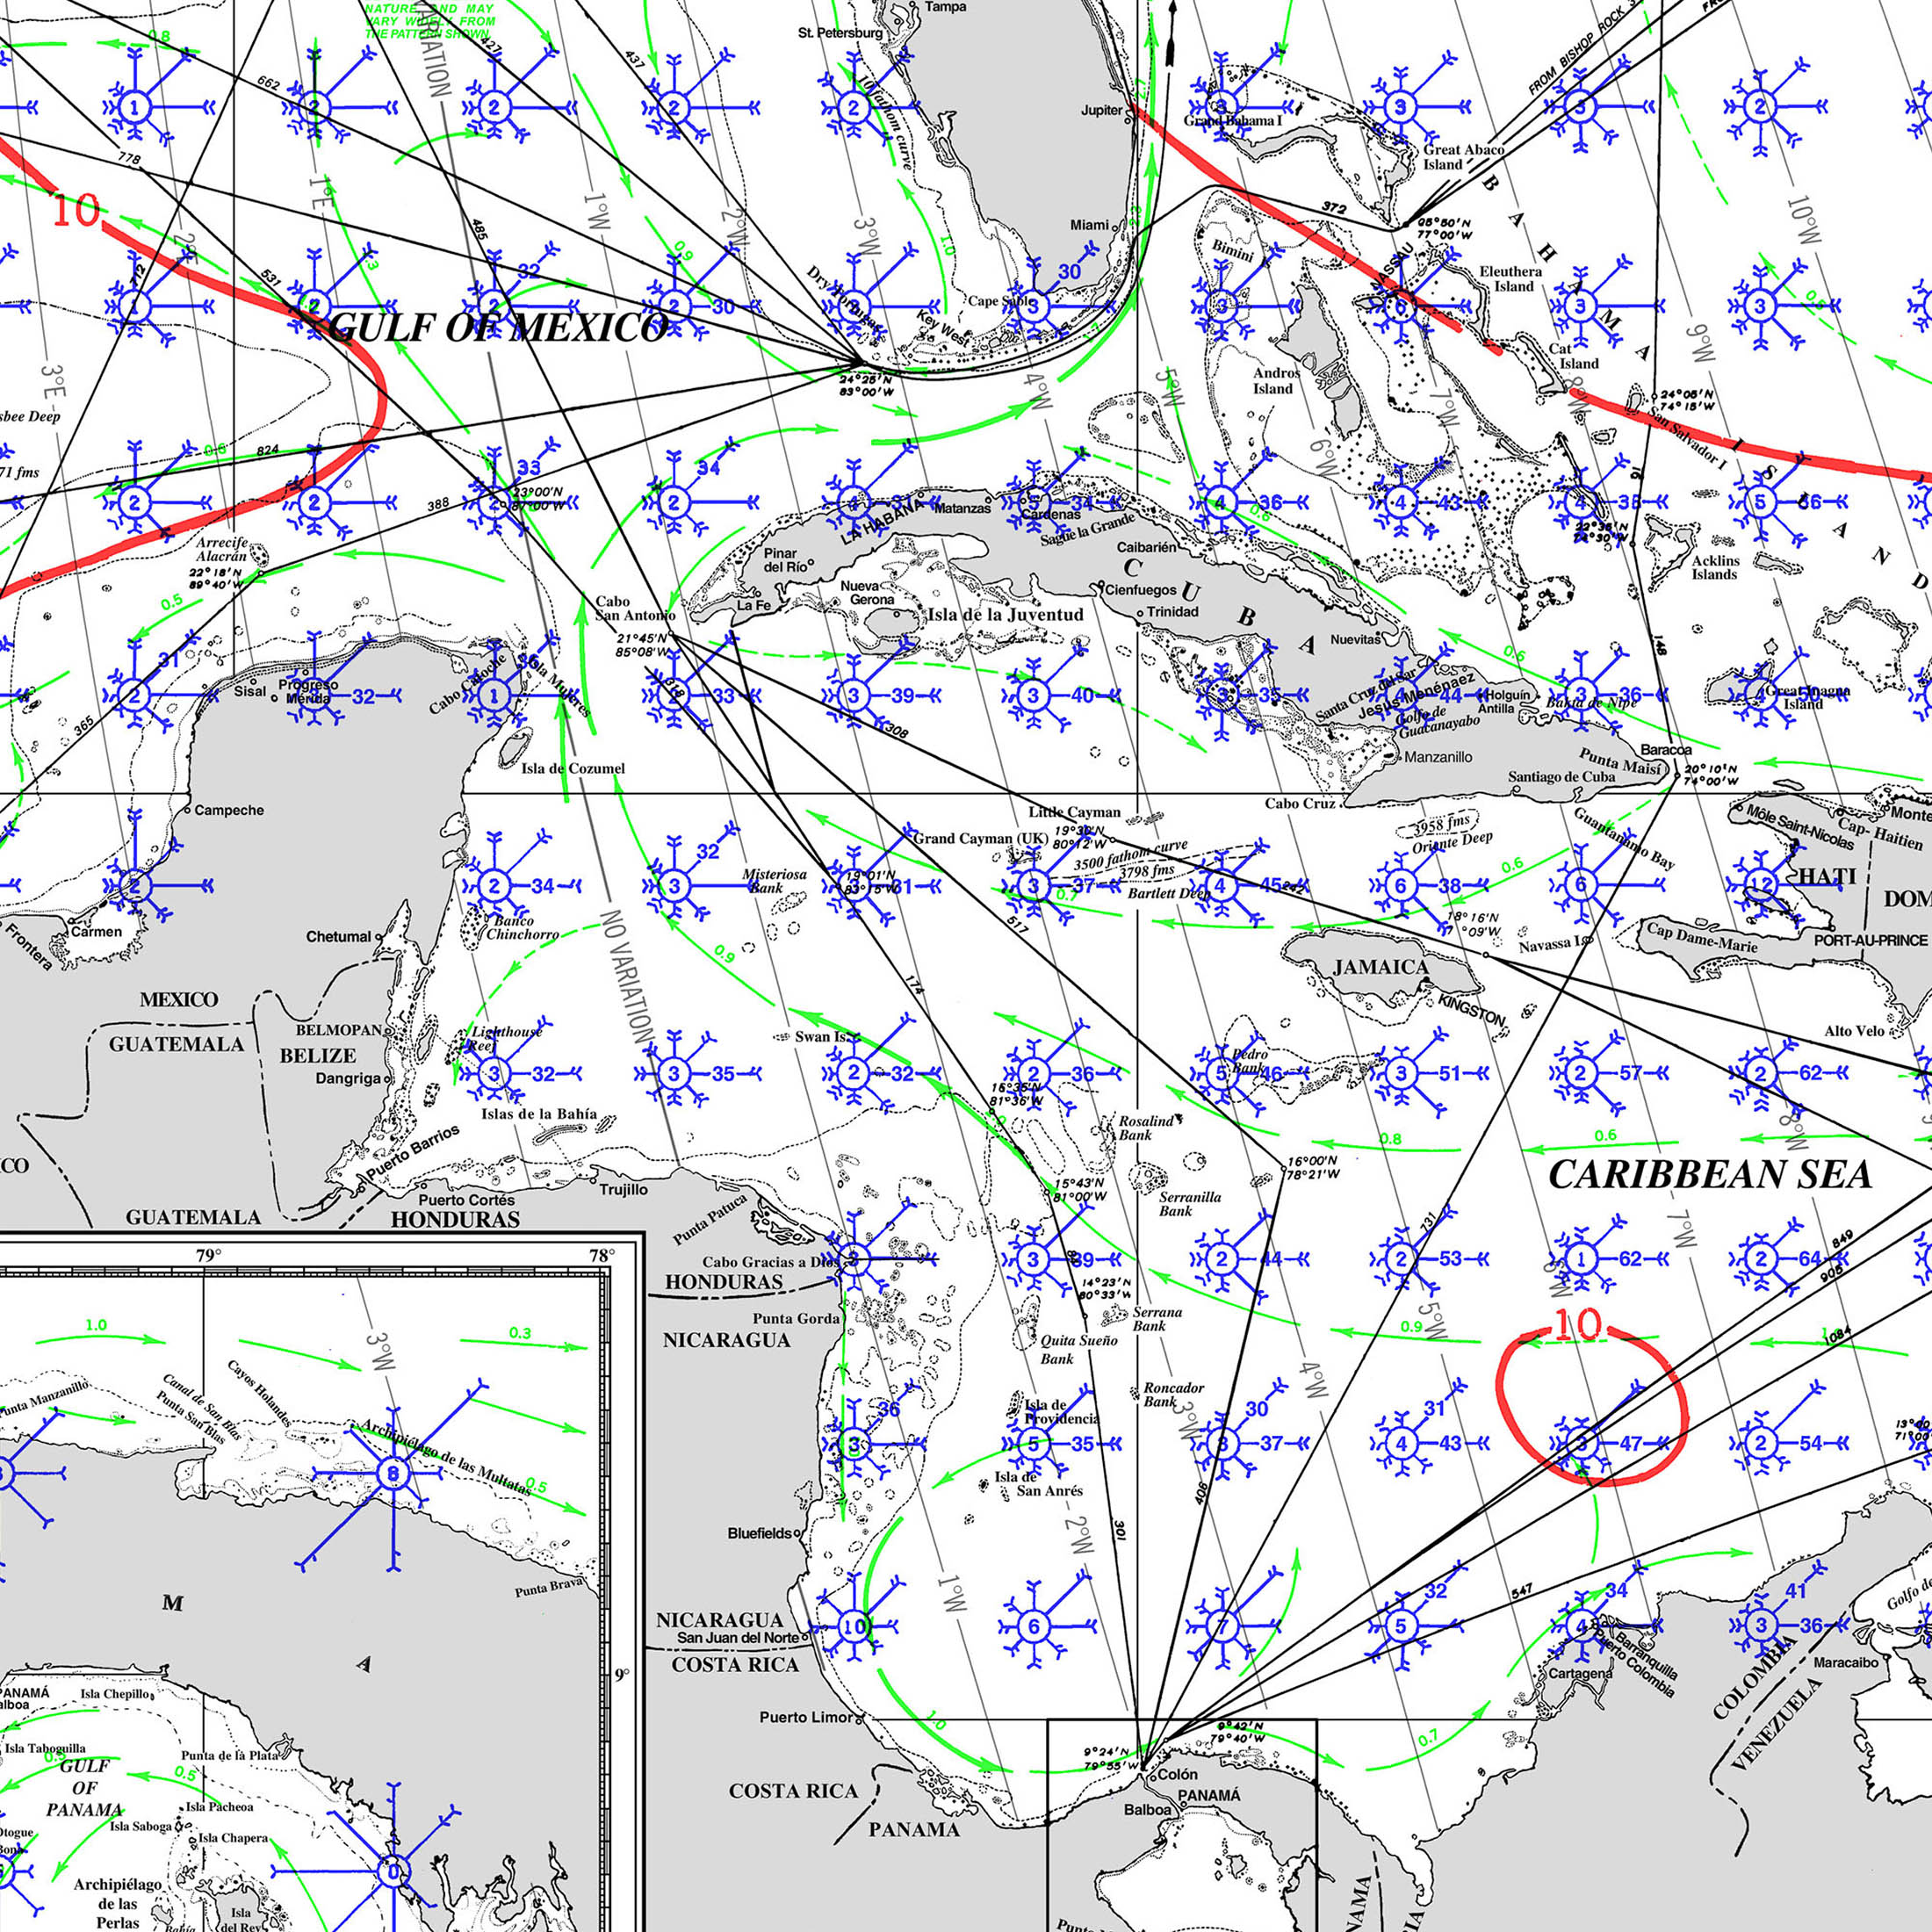
4. participating in this rally carries certain risks – you could die – be seriously incapacitated – suffer from permanent injuries leading to death.
You could be seriously injured or die when participating. The content contained on Panama Posse and Good Nautical is not intended to replace the need for professional maritime piloting. Professional instruction and supervision is necessary to safely sail and voyage on water. The content provided by Panama Posse may be inaccurate or outdated, and Panama Posse makes no claims to the accuracy of any of its content. Panama Posse is not responsible for any loss or injury resulting from inaccurate, insufficient, user generated or outdated data. Never rely on any Panama Posse content for the personal safety of you or others.
YOUR VESSEL YOUR CREW YOUR RESPONSIBILITY
Termination
We reserve the right in our sole discretion and at any time to terminate or suspend your Membership and/or block your access to our Websites for any reason including, without limitation if you have failed to comply with the letter and spirit of these Terms of Use. You agree that Panama Posse shall not be liable to you or any third party for any termination or suspension of your Membership or for blocking your access to our Websites.
If you become a registered user, you may terminate your Membership at any time by going to Membership page and selecting the appropriate option.
Any suspension or termination shall not affect your obligations to us under these Terms of Use. The provisions of these Terms of Use which by their nature should survive the suspension or termination of your Membership or these Terms of Use shall survive including, but not limited to the rights and licenses that you have granted hereunder, indemnities, releases, disclaimers, limitations on liability, provisions related to choice of law, dispute resolution, no class action, no trial by jury and all of the miscellaneous provisions in Section 17.
Copyright Policy
Panama Posse respects the intellectual property rights of others and expects its users to do the same. In appropriate circumstances and at its sole discretion, Panama Posse may terminate and/or disable the Membership of users who it suspects to be infringers of the copyrights (or other intellectual property rights) of others. Additionally, in appropriate circumstances and in its sole discretion, Panama Posse may remove or disable access to material on any of its websites or hosted on its systems that may be infringing or the subject of infringing activity.
In accordance with the Digital Millennium Copyright Act of 1998, we will respond promptly to claims of copyright infringement that are reported to the agent that we have designated to receive notifications of claims infringement (its “Designated Agent”). PanamaPosse .com’s Designated Agent is: Panama Posse
Physical Mail:
Marina Puerto de la Navidad, Jalisco Mexico
c/o Panama Posse
If you are a copyright owner (or authorized to act on behalf of the copyright owner) and believe that your work’s copyright has been infringed, please report your notice of infringement to us by providing our Designated Agent with a written notification of claimed infringement that includes substantially the following:
A physical or electronic signature of a person authorized to act on behalf of the owner of an exclusive right that is allegedly infringed.
Identification of the copyrighted work claimed to have been infringed, or, if multiple copyrighted works at a single online site are covered by a single notification, a representative list of such works at that site.
Identification of the material that is claimed to be infringing or to be the subject of infringing activity and that is to be removed or access to which is to be disabled, and information reasonably sufficient to permit us to locate the material.
Information reasonably sufficient to permit us to contact you, such as an address, telephone number, and, if available, an electronic mail address at which you may be contacted.
A statement that you have a good faith belief that use of the material in the manner complained of is not authorized by the copyright owner, its agent, or the law.
A statement that the information in the notification is accurate, and under penalty of perjury, that you are authorized to act on behalf of the owner of an exclusive right that is allegedly infringed.
We will investigate notices of copyright infringement and take appropriate actions under the DMCA. Inquiries that do not follow this procedure may not receive a response.
Choice of Law
These Terms of Use shall be construed in accordance with international Maritime Law without regard to its conflict of laws rules. Any action arising out of your use of the Website or these Terms and Conditions shall be brought via the International Tribunal for the Law of the Sea, Am Internationalen Seegerichtshof 1, 22609 Hamburg Germany
Dispute Resolution
In the Dispute Resolution Section only, “we” and “us” are used to refer to you and Panama Posse together.
We each agree to first contact each other with any disputes and provide a written description of the problem, all relevant documents/information and the proposed resolution. You agree to contact us with disputes by contacting us at the address provided in these Terms of Use. We will contact you based on the contact information you have provided us.
We each agree to finally settle all disputes (as defined and subject to any specific exceptions below) only by arbitration. In arbitration, there’s no judge or jury and review is limited. However, just as a court would, the arbitrator must honor the terms and limitations in the Terms of Use and can award the same damages and relief, including any attorney’s fees authorized by law. The arbitrator’s decision and award is final and binding and judgment on the award may be entered in any court with maritime jurisdiction. We each also agree as follows:
“Disputes” are any claims or controversies against each other related in any way to our Websites, Website Content or these Terms of Use – this includes claims you bring against our employees, agents, affiliates or other representatives, and claims Panama Posse may bring against you.
If either of us wants to arbitrate a dispute, we agree to send written notice to the other providing a description of the dispute, previous efforts to resolve the dispute, all supporting documents/information, and the proposed resolution. We will send notice to you based on the contact information you have provided us and notice to us must be sent to: PanamaPosse .
We agree to make attempts to resolve the dispute. If we cannot resolve the dispute within seven hundred and twenty (720) days of receipt of the notice to arbitrate, then we may submit the dispute to formal arbitration.
The FAA applies to this Agreement and arbitration provision. We each agree the FAA’s provisions, not state law, govern all questions of whether a dispute is subject to arbitration.
The arbitration will be administered by a National Arbitration Forum (“NAF”) under its arbitration rules. If any NAF rule conflicts with these Terms of Use, these Terms of Use apply.
Unless we each agree otherwise, the Arbitration will be conducted by a single neutral arbitrator and will take place at the International Tribunal for the Law of the Sea, Am Internationalen Seegerichtshof 1, 22609 Hamburg Germany, otherwise, the Arbitration will take at a specified location on the high seas by the Panama Posse. The law of the seas applies to these Terms of Use will also apply during the arbitration.
We each agree not to pursue arbitration on a classwide basis. We each agree that any arbitration will be solely between you and us (not brought on behalf of or together with another individual’s claim). If for any reason any court or arbitrator holds that this restriction is unconscionable or unenforceable, then our agreement to arbitrate doesn’t apply and the dispute must be brought in court.
We each are responsible for our respective costs relating to counsel, experts, and witnesses, as well as any other costs relating to the arbitration. However, we will not cover any arbitration administrative or filing fees for a court action in the appropriate jurisdiction if you are seeking 1/1000 th of a bitcoin or more from us.
Either of us may not bring qualifying claims in small claims court.
No Class Actions
TO THE EXTENT ALLOWED BY LAW, WE EACH WAIVE ANY RIGHT TO PURSUE DISPUTES ON A CLASSWIDE BASIS; THAT IS, TO EITHER JOIN A CLAIM WITH THE CLAIM OF ANY OTHER PERSON OR ENTITY, OR ASSERT A CLAIM IN A REPRESENTATIVE CAPACITY ON BEHALF OF ANYONE ELSE IN ANY LAWSUIT, ARBITRATION OR OTHER PROCEEDING.
No Trial By Jury
TO THE EXTENT ALLOWED BY LAW, WE EACH WAIVE ANY RIGHT TO TRIAL BY JURY IN ANY LAWSUIT, ARBITRATION OR OTHER PROCEEDING.
Amendment; Additional Terms
We reserve the right in our sole discretion and at any time and for any reason, to modify or discontinue any aspect or feature of our Websites or to modify these Terms of Use. In addition, we reserve the right to provide you with operating rules or additional terms that may govern your use of our Websites generally, unique parts of our Websites, or both (“Additional Terms”). Any Additional Terms that we may provide to you will be incorporated by reference into these Terms of Use. To the extent any Additional Terms conflict with these Terms of Use, the Additional Terms will control.
Modifications to these Terms of Use or Additional Terms will be effective immediately upon notice, either by posting on our Websites or by notification by email or conventional mail. It is your responsibility to review the Terms of Use and our Websites from time to time for any changes or Additional Terms. Your access and use of any our Websites following any modification of these Terms of Use or the provision of Additional Terms will signify your assent to and acceptance of the same. If you object to any subsequent revision to the Terms of Use or to any Additional Terms, you may terminate your Membership as provided in Section B herein or, if you do not have an Membership, your only recourse is to immediately discontinue use of our Websites.
Miscellaneous
No waiver by either party of any breach or default hereunder shall be deemed to be a waiver of any preceding or subsequent breach or default. The section headings used herein are for convenience only and shall not be given any legal import. If any provision of these Terms of Use is held to be invalid or unenforceable, the invalidity of such provision shall not affect the validity of the remaining provisions of the Terms of Use, which shall remain in full force and effect.
These Terms of Use (including the Privacy Policy and any Additional Terms incorporated by reference) constitute the entire agreement of the parties with respect to the subject matter hereof, and supersede all previous written or oral agreements between us with respect to such subject matter.
You may not assign these Terms of Use or assign any rights or delegate any obligations hereunder, in whole or in part, without our prior written consent. Any such purported assignment or delegation by you without the appropriate prior written consent will be null and void and of no force and effect. Panama Posse may assign these Terms of Use or any rights hereunder without your consent and without notice.
Notices
All notices, requests, and communications here under shall be in writing, and any such notice, request or other communication shall be deemed to have been given or made when delivered by hand, transmitted AND confirmed by the Panama Posse.